In the fast-paced world of garment manufacturing, precision is everything. From cutting tables to sewing lines, each process must follow a rhythm. That rhythm is defined by production targets. Among them, hourly production targets serve as a key performance metric.
Why do hourly targets matter? Because time is money in this industry. Each hour lost to inefficiency translates to missed shipments, increased labor costs, and unsatisfied clients.
Factories across Bangladesh, Vietnam, China, and India produce millions of garments daily. Each of those garments requires a calculated plan to meet delivery timelines. That’s where production targets come in—especially hourly ones. They allow line supervisors and industrial engineers to measure real-time performance, reduce downtime, and maintain productivity.
Understanding how to calculate an hourly production target isn’t just a mathematical exercise. It’s a management skill. It bridges the gap between labor efficiency and delivery goals.
This article will break down the topic in detail. You’ll learn what factors influence hourly production targets, how to calculate them, and how to avoid common mistakes. We’ll include real-world formulas, sample calculations, and best practices used in top-performing factories.
Understanding Production Targets: Why They Matter
In any manufacturing environment, targets guide performance. In the garment industry, production targets determine the daily output needed to meet buyer demands. But the hourly production target—often overlooked—is the most immediate measure of efficiency on the factory floor.
The Core Purpose of Production Targets
Production targets serve several key functions:
- Planning: Helps managers allocate labor and machines effectively.
- Monitoring: Provides real-time insights into whether a sewing line is on track.
- Accountability: Each operator or team is measured by their ability to meet or exceed hourly goals.
- Incentivization: Many factories use targets as the basis for incentive schemes, rewarding high-performing lines.
Without these hourly benchmarks, it becomes difficult to assess the health of production. Supervisors can’t spot delays early. Managers can’t adjust resources in real time. And workers have no clear expectations.
Aligning with Global Production Demands
Let’s look at global standards. A typical garment factory producing knit T-shirts in Bangladesh may aim for 500–600 pieces per day on a line of 25 operators. That breaks down to around 60–75 pieces per hour.
These numbers aren’t chosen randomly. They’re derived from a mix of time study data, historical performance, and product complexity. Major brands like H&M, Zara, and Uniqlo require strict delivery timelines. Missing even one shipment can disrupt entire supply chains.
Bridging Efficiency with Output
Efficiency and output are tightly linked. Consider this example:
- If a line has a Standard Minute Value (SMV) of 5 minutes per piece,
- And the efficiency is 60%,
- Then with 25 operators working an 8-hour shift (excluding breaks),
- The target must reflect what’s realistically achievable—not theoretically perfect.
A well-set hourly production target considers such factors. It ensures that the workforce is neither overburdened nor underutilized.
Impact on Factory Operations
Hourly targets also help balance workloads between lines. In a 40-line factory, even small imbalances in hourly production can cause bottlenecks or idle machines. By setting clear and achievable hourly benchmarks, managers can smooth operations across departments—from sewing and finishing to packing.
More importantly, these targets are actionable. They provide the clearest signal when something is going wrong. If a line is behind on its hourly target, it might indicate issues such as:
- Machine breakdown
- Material shortage
- Operator fatigue
- Style complexity
In short, hourly production targets are like a factory’s heartbeat. They let management respond quickly to disruptions and maintain consistency.
Key Factors That Influence Hourly Targets
Setting an hourly production target isn’t as simple as dividing the day’s goal by the number of hours. Several variables directly affect how realistic and effective that target will be. Misjudging these factors can lead to operator burnout, missed deadlines, or unnecessary costs.
Let’s break down the most influential factors one by one.
1. Standard Minute Value (SMV)
SMV is the cornerstone of production planning. It refers to the time, in minutes, required to produce one unit of a garment under standard working conditions.
For example:
- A basic round-neck T-shirt may have an SMV of 5 minutes.
- A detailed denim jacket could have an SMV of 25–30 minutes.
SMV is determined through time studies and is influenced by:
- Number of operations
- Complexity of design
- Machine types used
- Skill level required
The higher the SMV, the lower the hourly output. A miscalculated SMV leads to unachievable targets and operator frustration.
2. Operator Skill Level
Not every sewing operator is equally skilled. Some may be new to a particular machine or garment style. Others may be experienced but slower due to fatigue or ergonomic issues.
Production planners must consider:
- Average skill level of the line
- Familiarity with the garment
- Training provided prior to style launch
For instance, a line sewing trousers for the first time will likely underperform during the first few days unless this is factored into the hourly goal.
3. Line Efficiency
Efficiency measures how well a sewing line performs compared to the ideal. It’s expressed as a percentage:
If a line is operating at 60% efficiency, it produces fewer garments than a line running at 80%, even with the same number of people and same SMV.
Factories often use historical line data to set realistic efficiency rates for planning purposes.
4. Machine Availability and Type
Production isn’t just about labor—it’s also about machines. Lack of specialized machines can slow down production.
Key considerations:
- Are the machines suitable for the garment’s operations?
- Are all machines functioning, or are breakdowns common?
- Are there standby machines or mechanics on hand for quick repairs?
An advanced flatlock machine can save minutes per unit compared to manual methods.
5. Style Complexity and Changeovers
Style changeovers—switching from one garment type to another—can drastically affect productivity. Operators need to adapt, machines need reconfiguring, and line balancing becomes challenging.
Factors to monitor:
- How different is the new style from the previous one?
- How much training is required for the new operations?
- Are new trims or accessories used?
It’s common to reduce hourly targets temporarily during the first day or two of a style change.
6. Absenteeism and Workforce Stability
If operators are absent or frequently rotated, line stability drops. This disrupts the rhythm of production and lowers output.
Managers should monitor:
- Daily attendance records
- Operator turnover rates
- The ratio of permanent vs. temporary labor
Stable lines almost always outperform unstable ones in terms of hourly targets.
7. Working Hours and Breaks
A standard shift may be 8 hours, but only 7.5 hours may be productive due to breaks and admin time. Calculate hourly targets based only on available working minutes, not calendar hours.
For example:
- 25 operators × 450 working minutes = 11,250 available minutes
That figure is critical in planning how many pieces can reasonably be produced in each hour.
8. Line Layout and Balancing
If operations are poorly distributed among operators, some will idle while others are overloaded. This affects throughput and hourly output.
Smart factories conduct pre-production line balancing using:
- Time-motion studies
- Operation breakdowns
- Simulation software
A well-balanced line can increase efficiency by up to 20%.
Step-by-Step Formula for Calculating Hourly Production Target
Once you understand the factors that affect production, the next step is turning those variables into a concrete, measurable hourly target. This chapter walks you through the exact process used by production planners and industrial engineers in top-performing garment factories.
We’ll use both the theoretical framework and real-world examples.
The Formula
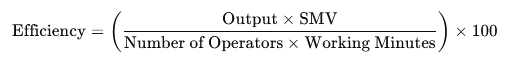
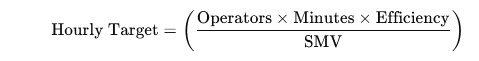
The basic formula to calculate hourly production target is:

This formula helps determine how many pieces your line should ideally produce in one hour under specific efficiency and labor conditions.
Breakdown of Each Variable
- Number of Operators:
Total number of sewing operators working on the line. - Working Minutes per Hour:
Usually 60 minutes, but can vary if there are planned mini-breaks or technical huddles. - Efficiency (%):
Target efficiency of the line (e.g., 60%, 75%). Use decimals in the formula (60% = 0.60). - SMV (Standard Minute Value):
Time required to make one garment, based on motion study.
Step-by-Step Example
Let’s say you manage a sewing line making men’s polo shirts. Here’s your data:
- Number of sewing operators: 20
- Working minutes per hour: 60
- Target line efficiency: 70%
- SMV of polo shirt: 6.5 minutes
Step 1: Convert efficiency percentage to decimal
70% → 0.70
Step 2: Plug values into the formula
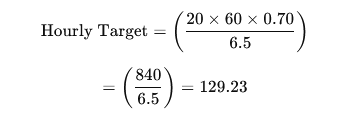
Step 3: Round to a whole number
Hourly Production Target = 129 pieces/hour
This means your line should aim to produce 129 complete polo shirts every hour, assuming all operators are present, machines are working, and the efficiency is stable at 70%.
Adjusting for Real-World Conditions
In actual factory conditions, the target may need adjustment due to:
- Learning curve for new styles: Reduce target by 10–15% for first few days.
- Known absenteeism trends: Adjust operator count daily.
- Mid-shift breaks or training sessions: Reduce total working minutes accordingly.
- Machine breakdown history: Include buffer if certain machines often fail.
You may also set upper and lower thresholds to account for variation. For example:
- Minimum acceptable target: 120 pieces/hour
- Target goal: 129 pieces/hour
- Stretch target: 135+ pieces/hour
This tiered system motivates the team and helps track underperformance early.
Tracking and Visualizing Progress
Many factories display real-time hourly targets and actual output using:
- Digital display boards
- Excel sheets printed per hour
- Tablet-based industrial engineering dashboards
Tracking not only keeps operators informed but also fosters accountability. If the line falls behind the target in one hour, they can push to recover in the next.
Hourly Target vs. Daily Target
It’s important to remember that daily targets are built on the foundation of hourly ones. If your line consistently misses hourly goals, you’ll miss daily output and, eventually, shipment deadlines.
To calculate daily production target:

Using our example:
- Hourly Target = 129 pieces
- Working Hours (excluding breaks) = 8 hours
Daily Target = 129 × 8 = 1,032 pieces
Standard Minute Value (SMV) and Its Role
The Standard Minute Value (SMV) is the cornerstone of garment production planning. It provides the foundation for every major decision on the production floor—from target setting and line balancing to labor cost estimation and incentive calculations.
In this chapter, we’ll explore exactly what SMV is, how it’s calculated, and why it’s so essential to setting realistic hourly production targets.
How is SMV Calculated?
SMV is calculated through Time Study or using Pre-determined Motion Time Systems (PMTS) such as GSD (General Sewing Data) or MODAPTS.
1. Time Study Method
A trained industrial engineer observes a skilled operator performing the task multiple times. Each motion is timed using a stopwatch. Then:
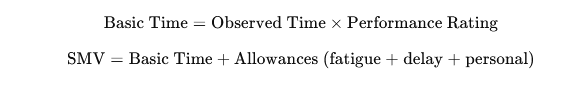
Example:
- Observed Time = 0.50 minutes
- Operator performance rating = 110%
- Basic Time = 0.50 × 1.10 = 0.55 minutes
- Allowance = 15% of basic time = 0.08
- SMV = 0.55 + 0.08 = 0.63 minutes
This process is repeated for each operation, and then added together to get the total SMV for the garment.
2. PMTS (GSD, MODAPTS)
These systems break down each movement into units based on body motion and calculate time using scientific tables. GSD is widely used in large global factories, including those supplying brands like Levi’s, H&M, and Decathlon.
PMTS benefits:
- High consistency
- Global standardization
- Lower dependency on stopwatch and human error
However, PMTS systems require licensing, training, and software investment.
Why SMV Matters So Much
1. Sets the Baseline for Hourly Production Targets
As shown in the previous chapter, the SMV is in the denominator of the production target formula. A small difference in SMV can lead to large variations in target output.
- If SMV = 5.0, your hourly target may be 150 pieces.
- If SMV = 6.0, it drops to 125 pieces.
Inaccurate SMVs can result in:
- Overburdened workers
- Unrealistic planning
- Factory losses due to shipment delays
2. Enables Costing and Pricing
SMV is a direct input in calculating labor cost per garment, which influences product pricing for buyers. Labor-intensive garments with high SMVs typically cost more.
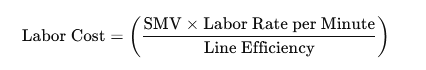
Factories that calculate SMVs precisely can negotiate better with buyers and maintain profitability.
3. Drives Line Balancing
Once you have the SMV for each operation (e.g., attaching sleeves, stitching collars), you can assign tasks to operators in a balanced way. The goal is to keep all operators working at roughly equal time loads, minimizing idle time.
4. Forms the Basis for Operator Incentives
Some factories pay performance-based bonuses. These bonuses depend on how much a worker produces relative to their SMV-based target. Without a trustworthy SMV, incentive systems become unfair and demotivating.
What Happens if SMV is Incorrect?
If SMV is too low:
- Operators will struggle to meet hourly targets.
- Quality may drop due to rushed work.
- Absenteeism and dissatisfaction increase.
If SMV is too high:
- Targets are too easy to meet.
- Labor cost per garment rises.
- Factory underperforms and loses orders.
SMV must be accurate and consistently updated, especially when styles change or new machines are introduced.
Understanding Line Efficiency and Its Impact
Efficiency is the heartbeat of garment production. It determines how effectively your team converts time and labor into actual garments. Without a solid understanding of efficiency—and how it impacts your hourly production target—you’re flying blind on the production floor.
In this chapter, we’ll explore what line efficiency really means, how it’s measured, and why even small shifts in efficiency can dramatically change your output and profit margins.
What is Line Efficiency?
Line efficiency is a percentage that reflects how close a production line comes to its maximum potential output, based on the standard minute values (SMVs) of the garments being produced.
It is calculated using this core formula:
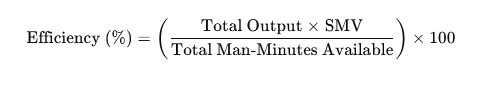
Breaking It Down
- Total Output: Number of garments produced in a given time.
- SMV: Standard time to produce one piece.
- Total Man-Minutes Available:
Number of workers × total working minutes (excluding breaks).
Example:
Let’s say:
- You have 20 operators
- Each works for 60 minutes
- You produce 120 pieces
- SMV is 6 minutes
Then:
- Total man-minutes = 20 × 60 = 1,200 minutes
- Total standard minutes produced = 120 × 6 = 720 minutes
- Efficiency = (720 ÷ 1200) × 100 = 60%
This means the line is operating at 60% of its theoretical maximum.
Why Efficiency Matters
Even a 5–10% shift in line efficiency can make or break your production targets. Consider two scenarios with the same resources:
- At 55% efficiency:
Hourly production target drops. More time and labor are needed to meet deadlines. - At 75% efficiency:
You produce more in less time. You may even reduce overtime or workforce, improving profitability.
High efficiency equals:
- Lower cost per garment
- Higher output per hour
- Better use of labor and machines
- On-time delivery with fewer bottlenecks
Factors That Affect Efficiency
- Skill level of operators
New or untrained workers reduce efficiency, especially on complex styles. - Style complexity and SMV
A higher SMV doesn’t always mean lower efficiency—but it demands better planning. - Line balancing issues
If one operator is overloaded, others may idle, dragging down overall performance. - Machine downtime
A few minutes of breakdown can affect hourly targets, especially in tightly scheduled lines. - Material issues
Poor fabric cutting or inconsistent trims cause rework, slowing down operations. - Management quality
Supervisors who solve issues quickly and maintain discipline tend to drive better efficiency.
Real-World Benchmarks
- New line with basic products: 45–55% efficiency
- Well-trained line with moderate styles: 60–70%
- High-performing lean lines with simple styles: 75–85%
- Elite, automated factories: 85–90% (rare and difficult to sustain)
According to a study by Apparel Resources India, most mid-sized garment factories operate at an average line efficiency of 60–65%.
Improving Efficiency on the Floor
- Training and cross-skilling
Operators should be trained in multiple tasks to prevent production halts. - Continuous monitoring
Use real-time dashboards or hourly tracking sheets. - Incentive schemes
Reward operators for exceeding targets without compromising quality. - Lean production techniques
Methods like U-shaped layouts and one-piece flow help minimize movement and delay. - Daily start-up meetings
Reviewing issues from the previous shift and setting expectations for the day ahead.
Efficiency’s Direct Impact on Hourly Targets
Let’s revisit the target formula:
Now consider a case with 20 operators, 60 minutes/hour, and an SMV of 6.5:
- At 50% efficiency, hourly target = (20 × 60 × 0.50) ÷ 6.5 = 92 pieces
- At 70% efficiency, hourly target = (20 × 60 × 0.70) ÷ 6.5 = 129 pieces
- At 85% efficiency, hourly target = (20 × 60 × 0.85) ÷ 6.5 = 157 pieces
The difference between 50% and 85% is 65 pieces/hour, or 520 pieces in a single shift.
That’s the difference between profit and loss.
Adjusting Targets for Learning Curve, Style Change, and Rework
Hourly production targets are not static. They are influenced by many real-world variables, and three of the most impactful are:
- The learning curve when starting a new style,
- Style changes that introduce complexity,
- And rework, which eats up productive time.
Even the most experienced factory floor must accommodate these factors. This chapter focuses on how each element affects your targets—and how to adjust for them without compromising quality or delivery timelines.
The Learning Curve Effect
Every time a new garment style is introduced to the line, operators need time to adapt. This is where the learning curve comes in.
What is a Learning Curve?
It describes how performance improves over time as workers repeat the same task. In garment manufacturing, this improvement is particularly visible in the first few days after style introduction.
For example:
A study by the Institute of Industrial Engineers found that output can improve by up to 30% in the first three days of sewing a new style.
Why It Happens
- Operators need to understand construction steps
- They must adjust to new sewing techniques or attachments
- Some tasks involve new tools or machines
- Line layout may shift to accommodate new process flows
Impact on Hourly Target
During the first 1–2 days:
- Efficiency drops by 10–25%
- Hourly target is temporarily lower
- Planning buffers must be applied
Example Adjustment:
Let’s say your normal hourly target is 120 pieces with 70% efficiency. For day 1 of a new style, reduce your efficiency assumption to 55%.

This avoids overburdening workers and keeps quality under control while they learn.
Dealing with Style Changes
Style changes can significantly alter production dynamics—even if fabric and product type remain the same.
Types of Style Changes That Affect Output:
- Number of operations (e.g., 15 vs. 28 steps)
- Garment complexity (e.g., zipper hoodie vs. basic tee)
- Different machinery (e.g., fusing, bar tacking, overlock attachments)
- Additional trims or linings
- Custom buyer-specific quality checkpoints
Best Practices During Style Change:
- Pre-production trials
Always run a pilot of 20–50 pieces to identify bottlenecks. - Update the SMV
Never assume the previous SMV applies. Time-study the new style or estimate through PMTS tools. - Revise efficiency expectations
Teams often perform 5–15% below their usual efficiency when switching styles. - Buffer your plan
Allow a ½ to 1-day buffer depending on complexity, especially for first-time styles.
How Rework Affects Production Targets
Rework is a productivity killer. When garments need to be repaired due to stitching errors, poor trimming, or misaligned parts, they must be removed from the production line, fixed, and sometimes even redone entirely.
Common Causes of Rework:
- Poor quality fabric
- Lack of clear specifications or tech packs
- Untrained or fatigued operators
- Machine problems
- Ineffective quality inspections
How Rework Impacts Hourly Target:
- Time is lost on repairs
Workers spend time fixing instead of producing new pieces. - Operators are distracted or demotivated
Focus drops, increasing the chance of more mistakes. - It affects line flow
If an operator is busy fixing 15 faulty collars, the next in line must wait.
Rework Rate and Target Adjustment:
If your daily rework rate is 8%, and you plan to make 1000 garments, only 920 are first-pass yield.
To compensate:
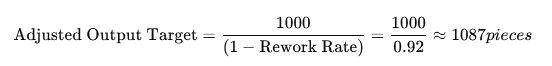
Combining All Factors in Real Life
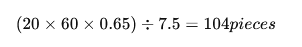
Case Study Example:
- A factory introduces a new women’s blouse style
- Initial SMV: 7.5
- Normal line efficiency: 65%
- First-day drop due to learning: down to 50%
- Rework rate observed on first day: 10%
Normal hourly target:
Adjusted target with learning curve and rework:
- Adjusted efficiency: 50%
- First-pass yield = 90%
- Actual production needed per hour = (20×60×0.50)7.5×0.90≈89\frac{(20 × 60 × 0.50)}{7.5 × 0.90} ≈ 897.5×0.90(20×60×0.50)≈89 pieces
This shows that under real-world conditions, targets must be flexibly managed.